Table of Contents
Welcome to the 4th part of the tutorial. In this part, you'll learn the theory behind the finite volume (FV) part of the code and how to use it yourself.
Theory
See Theory & Implementation Finite Volume (FV) (old).
Tutorial
- Compile maia in production, e.g.
./configure.py gnu production - Take a single twelve node interactive session, see this tutorial.
- Run ParaView in an additional terminal from your local device within the tutorials' directory.
FV 3D_cyl_fan
To begin with, we will run a normal FV case and change some of its numerical value to show what we can influence. In this case, a stream flows into a 3D cylinder with a 45-degree angle of rotation around the z-axis which imitates a fan. The flow around one of the pylons Mach speed 0.1 and Re 50000 is simulated.
1. Getting the files and running them with default values
Download the test case setup files, and create a soft link to the solver executable:
On AIA cluster, obtain an interactive sussion, then generate the grid and run simulation:
Note: For better visualization of the geometry, set outputFormat="VTU" in properties_run.toml.
In an additional local terminal, run ParaView for post-processing:
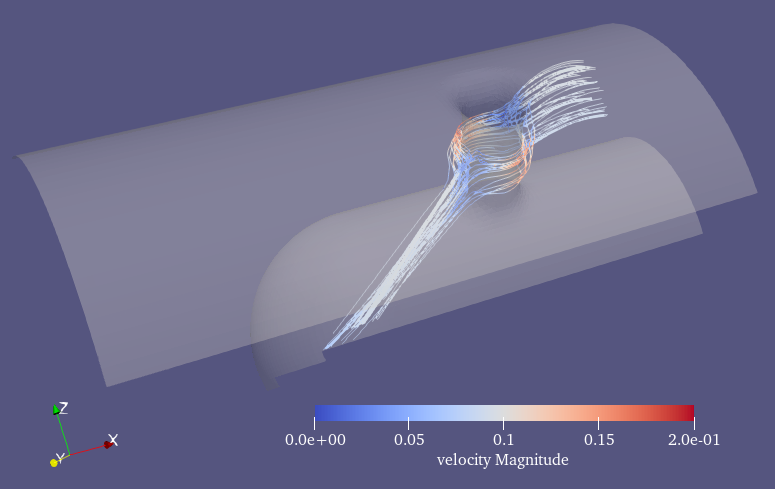
- Open the file out/GEOM_10.vtp and out/QOUT_10.vtu. Show them individually. You will see the GEOM file contains the wall boundary of the fan and the QOUT file saves the flow field data.
- Select the GEOM file, show it and set
Styling/Opacity = 0.3. - Select the QOUT file, hide it and create a stream-tracer fileter on the velocity vector. For the stream-tracer filter properties, set
Seed Type = Point Source,Sphere Center = [50, 185, 215],Sphere Radius = 5, and cancell Show Sphere. Press apply and color the stream lines with velocity magnitude. - Now we can see a group of streamlines flow through the cylinder fan.

Only one output file and pretty early (10 timesteps). Sadly not much to see... so let's continue!
2. Setup restart and increase timesteps
- Create a restart property file, using
cp properties_run.toml properties_restart.toml - In properties_restart.toml, set
restartFile = true,restartTimeStep = 10andtimeSteps = 200. - Remove the old solution file(s)
rm out/QOUT* out/GEOM*
- Restart the simulation
mpirun -np 12 ./maia properties_restart.toml - parav
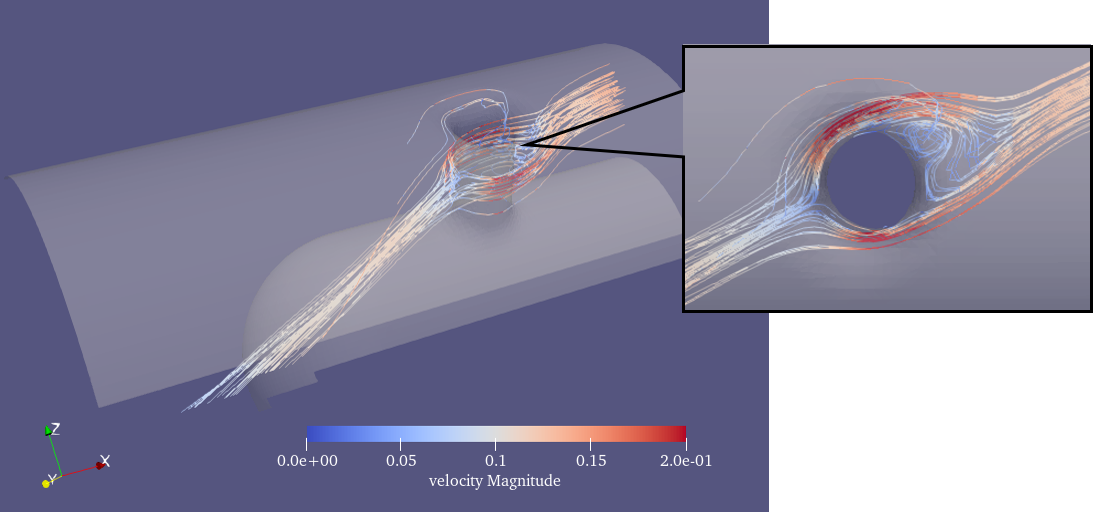
- Open the file list out/GEOM_**.vtp and out/QOUT_**.vtu.
- Repeat the rest ParaView operations in the previous subsection.
- Press
play, we can see the change in the streamlines from time step 10 until time step 210. At later timesteps, flow separation after the cylinder can be observed.

Now the simulated flow visualization is good, let's change the physics and numeric of the simulation.
3. Changing physics and numeric (optional)
- Open properties_run.toml, look at the
# PHYSICSand# NUMERICSpart. - Play around with the properties and rerun the simulation. For example: change angle from [45.0, 0.0] to [0.0, 0.0] Angles of rotation around the z and y axis, to see how the flow angle affects the stream lines.